[imgui] 2. Plotter 구현
목표
- ImPlot을 사용해서 sin(x), cos(x) 데이터 플로팅.
- ImPlot : 그래프를 플로팅 하는 ImGui 기반의 데이터 시각화 라이브러리이다.
Plotter
구현코드
메인함수
ImPlot 라이브러리의 자원과 컨텍스트 초기화, 정리를 수행하는 코드
// main.cpp
ImPlot::CreateContext();        // ImPlot 초기화
while (!glfwWindowShouldClose(window))
{
    start_cycle();

    ImGui::NewFrame();
    render(window_obj);
    ImGui::Render();

    end_cycle(window);
}
ImPlot::DestroyContext();       // ImPlot 정리
Plotter의 구현 코드
#include <cstdint>
#include <string_view>
#include <array>
#include <set>

class WindowClass
{
public:
    // 표시할 그래프 이름들을 지정. 체크박스 label로도 사용된다.
    constexpr static auto functionNames = std::array<std::string_view, 3>{
        "unk", "sin(x)", "cos(x)",
    };
    // 함수 인덱스 순서 enum값
    enum class Function
    {
        NONE,
        SIN,
        COS,
    };


public:
    WindowClass() : selectedFunctions({}) {};
    void Draw(std::string_view label);

private:
    void DrawSelection();   // 체크박스를 그리는 함수
    void DrawPlot();        // ImPlot을 이용해서 그래프를 그리는 함수

    // 이름과 enum 매핑
    Function functionNameMapping(std::string_view function_name);

    // 그래프를 그리기 위해 y값을 계산하는 함수
    double evaluateFunction(const Function function, const double x);

public:
    // 현재 선택된 함수 리스트
    std::set<Function> selectedFunctions;

};

void render(WindowClass &window_obj);
DrawSelection
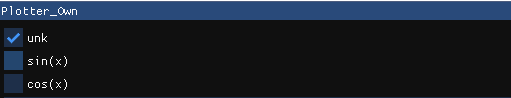
체크박스를 그려주는 함수이다.
// 함수 이름을 enum으로 변경
WindowClass::Function WindowClass::functionNameMapping(
    std::string_view function_name)
{
    if (function_name == std::string_view{"sin(x)"})
        return WindowClass::Function::SIN;
    if (function_name == std::string_view{"cos(x)"})
        return WindowClass::Function::COS;
    return WindowClass::Function::NONE;
}

// 실제로 체크박스를 그리는 작업
void WindowClass::DrawSelection()
{
    // 전체 정의된 함수이름들에서 하나씩 가져다가 체크박스로 그려준다.
    // 이때 selectedFunctions에 포함되어 있으면 체크된 체크박스를 그린다.
    for (const auto func_name : functionNames)
    {
        // 함수이름을 전달해서 enum값으로 변경
        const auto curr_function = functionNameMapping(func_name);

        // selectedFunctions에 포함되어 있는지 확인.
        auto selected = selectedFunctions.contains(curr_function);

        // 클릭 시 리턴값은 true
        // 2번째 인자로 bool* 를 넘겨서 체크 여부 업데이트
        if (ImGui::Checkbox(func_name.data(), &selected)) {
            // 이번에 눌러서 체크가 됐다면 selectedFunctions에 추가 아니라면 지우기
            if (selected) {
                selectedFunctions.insert(curr_function);
            }
            else {
                selectedFunctions.erase(curr_function);
            }
        }
    }
}
DrawPlot
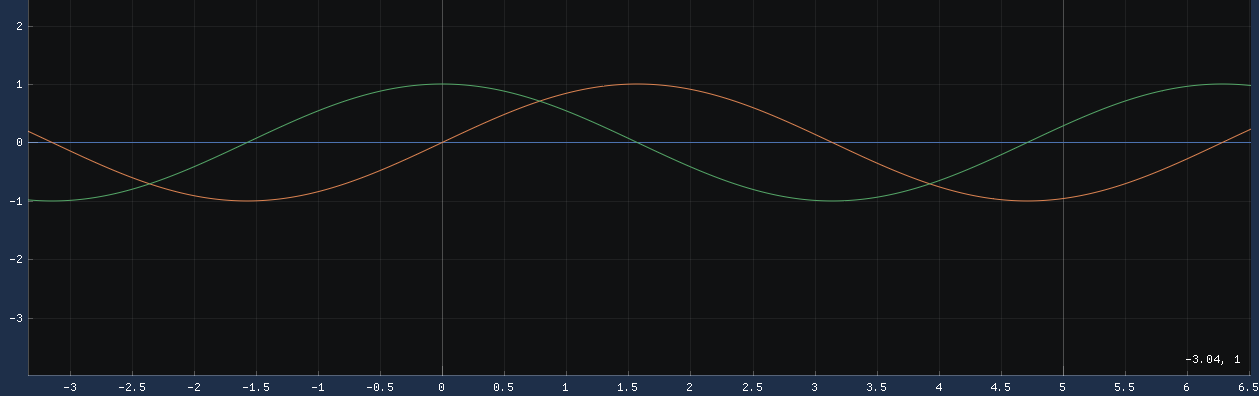
x, y 좌표를 계산해서 그래프로 그려주는 함수이다.
// x,y 좌표를 받아서 Plot을 그린다.
void WindowClass::DrawPlot()
{
    static constexpr auto num_points = 10'000;      // 최대 10000개의 Plot
    static constexpr auto x_min = -100.0;           // -100.0 ~ 100.0 사이의 Plot을 표시할 예정
    static constexpr auto x_max = 100.0;
    static constexpr auto x_step = (x_max - x_min) / num_points;  // Plot의 간격

    static auto xs = std::array<double, num_points>{};            // 각 Plot의 x, y좌표
    static auto ys = std::array<double, num_points>{};

    // ImPlot의 시작을 알리는 함수.
    // 2번째 인자로 {-1, -1}을 전달하면 Window에서 남은 크기를 다 채운다는 뜻
    ImPlot::BeginPlot("###Plot", ImVec2(-1.0F, -1.0F), ImPlotFlags_NoTitle);

    // 만약 선택된 그래프가 없다면, 아무것도 그리지 않고 종료
    if (selectedFunctions.size() == 0 ||
        (selectedFunctions.size() == 1 &&
         *selectedFunctions.begin() == Function::NONE))
    {
        ImPlot::EndPlot();
        return;
    }

    for (const auto& function : selectedFunctions)
    {
        auto x = x_min;
        // -100 ~ 100 사이의 Plot 데이터 추가
        for (std::size_t i = 0; i < num_points; ++i)
        {
            xs[i] = x;
            ys[i] = evaluateFunction(function, x);    // x에 해당하는 y값 계산
            x += x_step;
        }

        const auto plot_label =
            fmt::format("##function{}", static_cast<int>(function));

        // Plot을 선으로 그리기
        ImPlot::PlotLine(plot_label.data(), xs.data(), ys.data(), num_points);
        // Plot을 점으로 그리기
        // ImPlot::PlotScatter(plot_label.data(), xs.data(), ys.data(), num_points);
    }
    ImPlot::EndPlot();
}
Comments